Scientific visualisations
Scientific visualisations are a core component of modern research, helping researchers share their findings and connect with their peers as well as a wider audience. Here at EPCC we produce a range of high quality scientific visualisations. Some recent examples are shown below.
These scientific visualisations were all produced by EPCC colleagues. If you would like to know more about the process, or are interested in collaborating with us on visualisation work, please contact us at info@epcc.ed.ac.uk.
Sunset on wind turbines
Sébastien Lemaire (EPCC), Andrew Mole (Imperial College London), Michèle Weiland (EPCC).
Two computational fluid dynamics (CFD) simulations of wind turbine wakes are shown. On the left are two turbines placed directly in line, while the simulation on the right shows the angle of the front turbine "steered" by 24 degrees. This steering redirects the wake generated by the front turbine, impacting the one downstream and increasing the overall power output; in this case a 12% increase is achieved. The video highlights both the large scale of turbine wakes and the potential impact of the wake steering method.
The video was designed and rendered using Blender. For an explanation of the work involved in its creation, see this EPCC News article 'Realistic visualisations of wind turbine flow to be shown at SC24' and the recording of the webinar 'The Science behind the Image Competition - 2'.
Further information
This video was accepted for SC24 Art of HPC and won the best video category of the ARCHER2 Image Competition 2024.
For information about the associated research, see the paper 'Multi-fidelity Bayesian Optimisation of Wind Farm Wake Steering using Wake Models and Large Eddy Simulations'.
Electromagnetic waves with gprMax
Sébastien Lemaire (EPCC), Nathan Mannall (EPCC), James Richings (EPCC)
This video shows a gprMax simulation modelling the propagation of electromagnetic fields coming from an above ground source into the earth. It models the interactions with the materials the fields come into contact with. The electric field (blue) is emitted at the surface, goes through the ground and interacts with a pair of perpendicular metallic pipes. These simulations enable the modelling of the return signature of subterranean structures and they have a variety of industry applications.
The simulation at the centre of the video uses an underlying grid of 750M cells and was run on eight nodes of the UK National Supercomputer ARCHER2. The data was then pre-processed using ParaView to export vdb files and perform a lossy data compression by discarding data points where the electromagnetic field is negligible. Finally, the scene and all its components were designed and rendered using Blender.
Further information
This video was included in SC25 Art of HPC. It was also placed first in the best video and the best overall image categories of the ARCHER2 image competition 2025.
Taylor Green vortex dance
Sébastien Lemaire (EPCC), Paul Bartholomew (EPCC), Erich Essmann (EPCC), Michèle Weiland (EPCC), Justs Zarins (EPCC), Mark Parsons (EPCC)
The visualisation shows a Computational Fluid Dynamics (CFD) simulation of Taylor-Green vortices. The Taylor-Green vortex test case is a common set up for benchmarking and validating CFD solvers. The flow is initialised with sin waves velocities. Vortices decay over time showing the different scales of turbulence. The simulation at the centre of the visualisation was performed by ASiMoV-ccs, a CFD and combustion code designed for large scale simulations.
The simulation was run on 16 nodes for 20 hours on ARCHER2. The data was then pre-processed using ParaView to compute the Q-criterion (quantity calculated from the velocity field and highlighting vortices). Finally the scene set up and all its components were designed using Blender.
Further information
This video has been accepted for SC25 Art of HPC and was submitted to the ARCHER2 image competition 2025.
Molecular dynamics
Sébastien Lemaire (EPCC), Rui Apóstolo (EPCC)
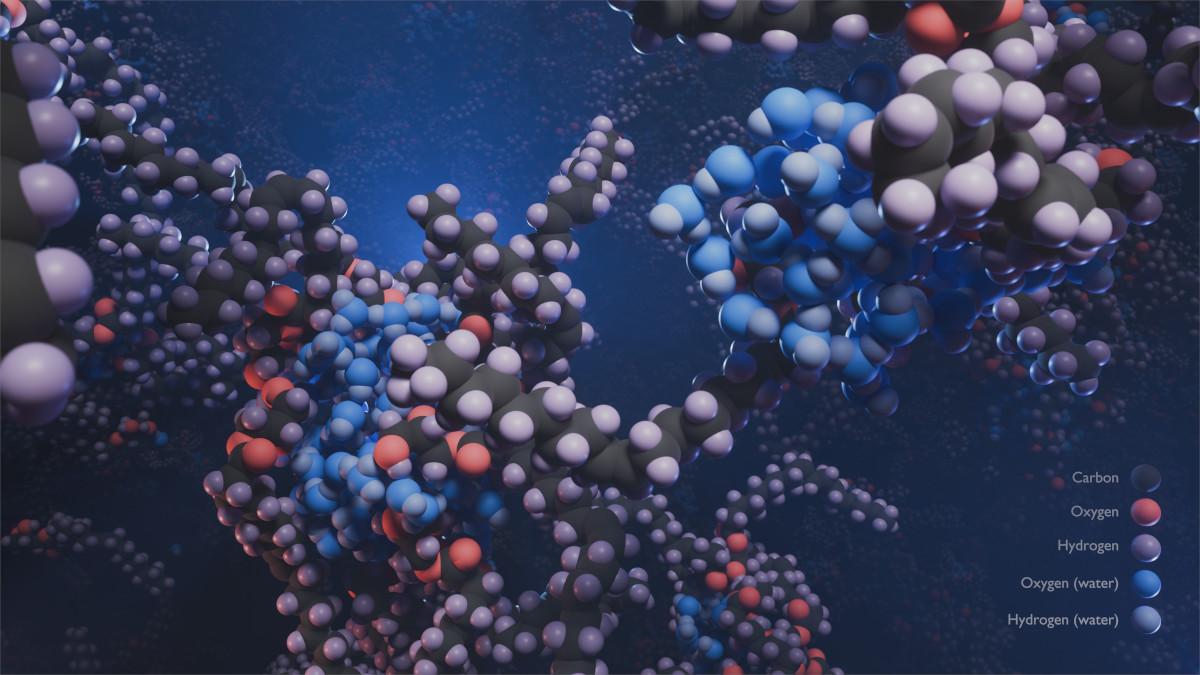
Lubrication is a complex but important problem; its study can help reduce wear between solid surfaces. Glycerol monooleate (GMO) is known to have impressive lubricating properties. The addition of a small amount of GMO to a lubricant can drastically lower its friction. The GMO molecules gather around small droplets of water forming "reverse-micelles". Under shear, these reverse-micelles get caught on the roughest areas of the solid surface and reduce the resultant friction.
In this image, which is based on a LAMMPS computation, the water molecules are blue, while the GMO molecules are shown as their atomistic components in black, red and purple. The solvent is hidden for clarity.
The visualisation was created using Blender, which allows for fine control over camera placement and lighting. This helps highlight important features of the computation while producing a visually pleasing image suitable for non-scientific audiences.
Further information
The associated research is described in this paper: Experimental and simulation study of self-assembly and adsorption of glycerol monooleate in n-dodecane with varying water content onto iron oxide.
This image was submitted for the ARCHER2 image competition 2024.
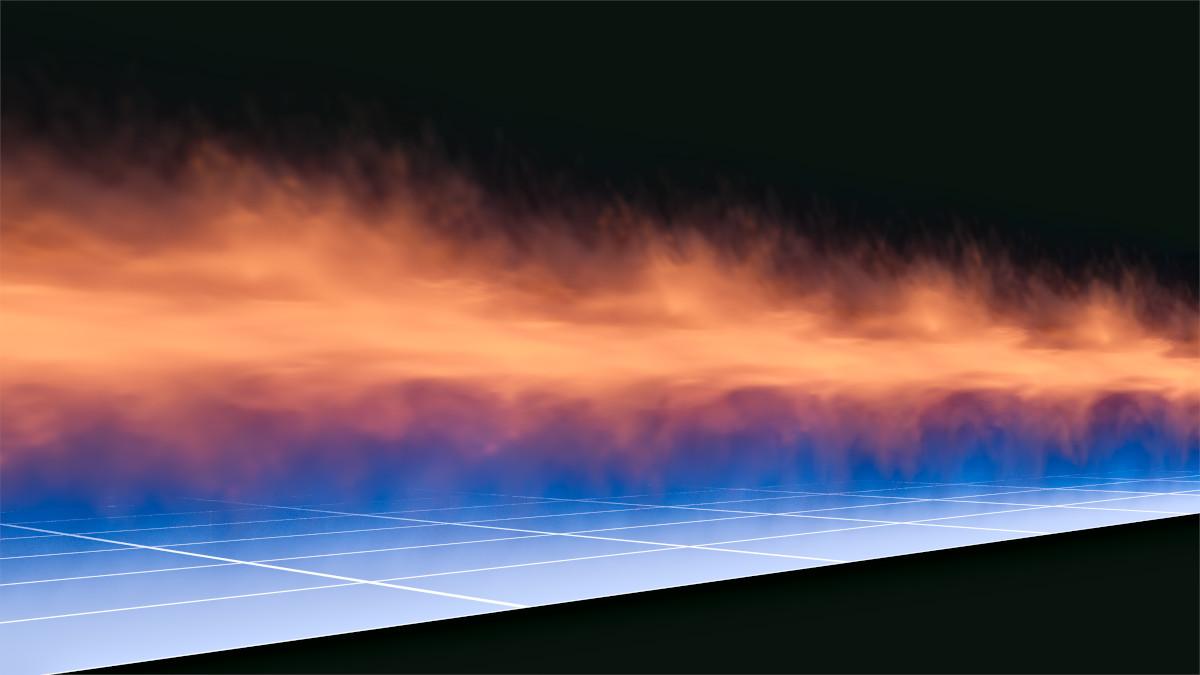
Combustion flame
Sébastien Lemaire (EPCC), Chris Goddard (Rolls-Royce)
This video shows a realistic render of the pilot jet flame D from the Sandia set of test cases. The simulation was performed by Chris Goddard (Rolls-Royce) as part of the ASiMoV project (EP/S005072/1) and the visualisation undertaken by Sébastien Lemaire (EPCC) using ParaView, Blender and Blender4science set of tools.
Infinite flow
Sébastien Lemaire (EPCC), Irufan Ahmed (Imperial College London), Paul Bartholomew (EPCC)
This image shows a fluid dynamics visualisation of a periodic channel flow performed by x3d2, a newly developed high-fidelity CFD solver with CPU and GPU backends.
A channel flow is a ubiquitous test case for analysing turbulence development and scales. The flow is bounded between two infinitely large planes and all the other directions are periodic, meaning the flow is recirculated once it leaves the computational domain. After an initial perturbation, all the scales of turbulence develop and are visible. In this image we highlight one of the infinitely long planes and the velocity field is displayed.
Further information
This image was accepted for SC25 Art of HPC.