A new high-resolution dataset for studying near-wall turbulence
4 June 2026
A collaboration with Imperial College London and Queen’s University Belfast will improve fundamental turbulence research and the development of better computational models.
Turbulence is central to many natural and engineering flows, from the air moving over aircraft wings to the flow of water around ships and the motion of fluids through pipes and arteries. Despite its importance, turbulence remains difficult to study because it is nonlinear, three-dimensional, chaotic and strongly multiscale. These challenges are especially acute close to solid walls, where small-scale flow structures play a major role in determining drag, mixing and energy loss.
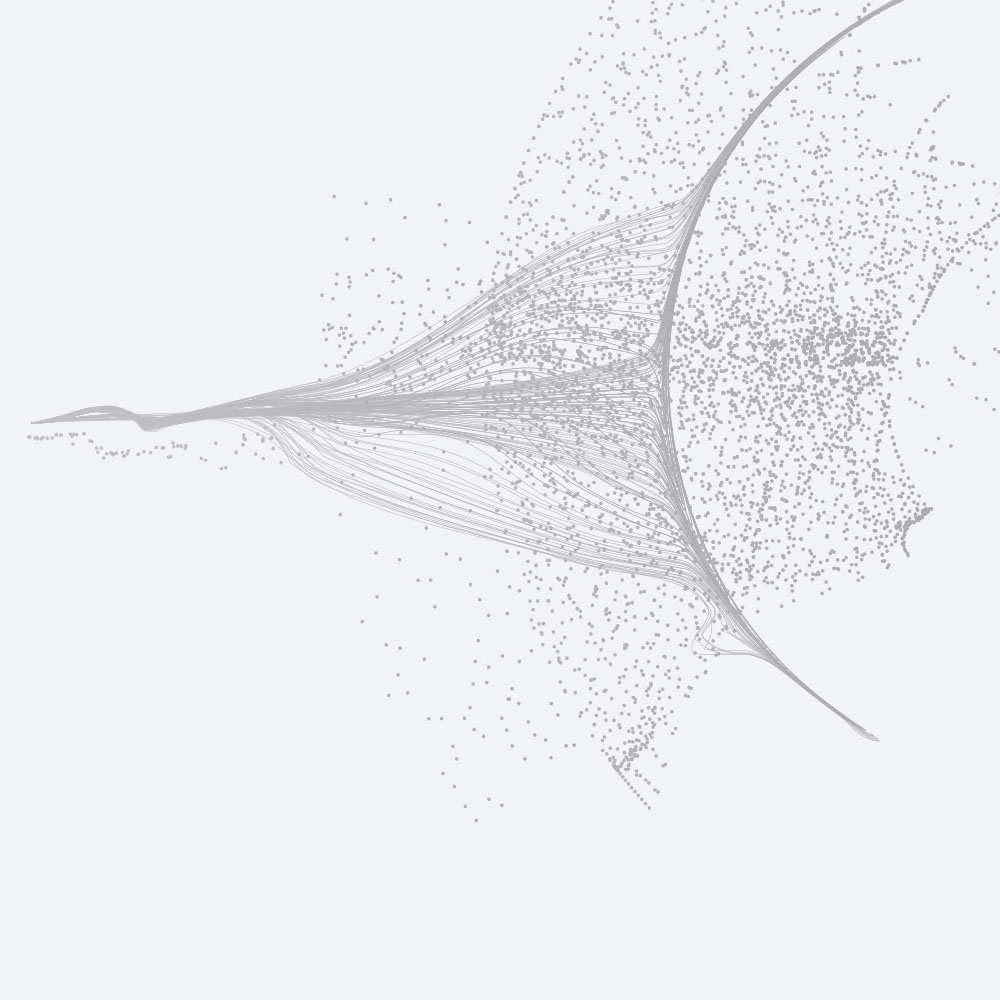
In collaboration with colleagues at Imperial College London and Queen’s University Belfast, we have produced a new dataset that provides high-resolution, time-resolved snapshots of the viscous sublayer in a turbulent boundary layer. The viscous sublayer is the near-wall region where viscous effects are particularly important. Although it is thin, it has a significant influence on the behaviour of the wider flow, making it an important target for both fundamental turbulence research and the development of improved computational models.
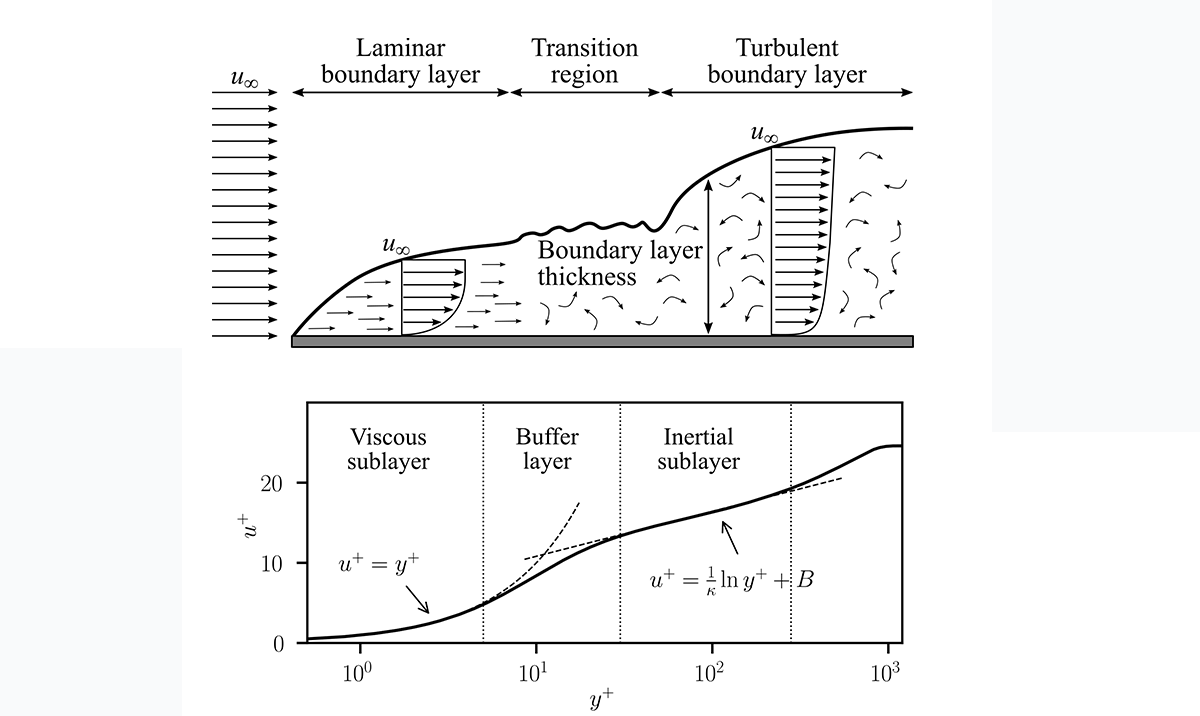
Figure 1: Overview of a turbulent boundary layer. Left: transition from laminar to turbulent flow. Right: mean velocity profile from the present dataset, showing the near-wall viscous sublayer.
The dataset was generated using direct numerical simulation with Incompact3d on ARCHER2, the UK National Supercomputing Service hosted and operated by EPCC. Direct numerical simulation resolves all dynamically relevant scales of motion, avoiding the need for turbulence modelling, but this makes it computationally demanding. For this dataset, the simulation produced 16,384 three-dimensional snapshots of the pressure and velocity fields in the near-wall region, amounting to approximately 11.1 TiB of data before compression.
Time-averaged turbulent statistics
Alongside the time-resolved snapshot data, we have also provided time-averaged turbulent statistics over the full boundary layer. These include the primary flow quantities and second-order velocity products, allowing users to compare against established reference data and check the validity of their own analyses. By providing both instantaneous three-dimensional fields and time-averaged statistics, the dataset supports two complementary modes of use. Researchers can examine the evolution of near-wall turbulent structures directly, while also using the statistical quantities to validate calculations, compare with existing literature, or benchmark lower-fidelity simulations and data-driven models.
Data accessiblility
A key aim of the work was to make the data accessible despite its size. After the simulation, the raw outputs were converted to Zarr v3 and published through the Edinburgh International Data Facility (EIDF), also operated by EPCC.
The dataset can be browsed through the CKAN dataset record, but for most users we expect programmatic access through the S3-compatible endpoint to be more convenient. Combined with the Zarr format, this enables access using third-party libraries such as Xarray, Zarr-Python and Dask, which expose familiar array-like interfaces for working with remote data. Users can slice arrays, perform arithmetic, use lazy loading and carry out parallel analysis without first downloading the full dataset locally. The data layout also uses chunking, sharding and compression to support efficient remote access.
To lower the barrier to entry, we have included example Python scripts demonstrating typical workflows: opening the remote data, plotting snapshot planes, working with time-averaged statistics, converting quantities to inner units, and sampling the data using a chunk-aware PyTorch DataLoader for machine-learning applications. These examples are intended both as a starting point for new users and as templates that can be adapted for more specialised analyses.
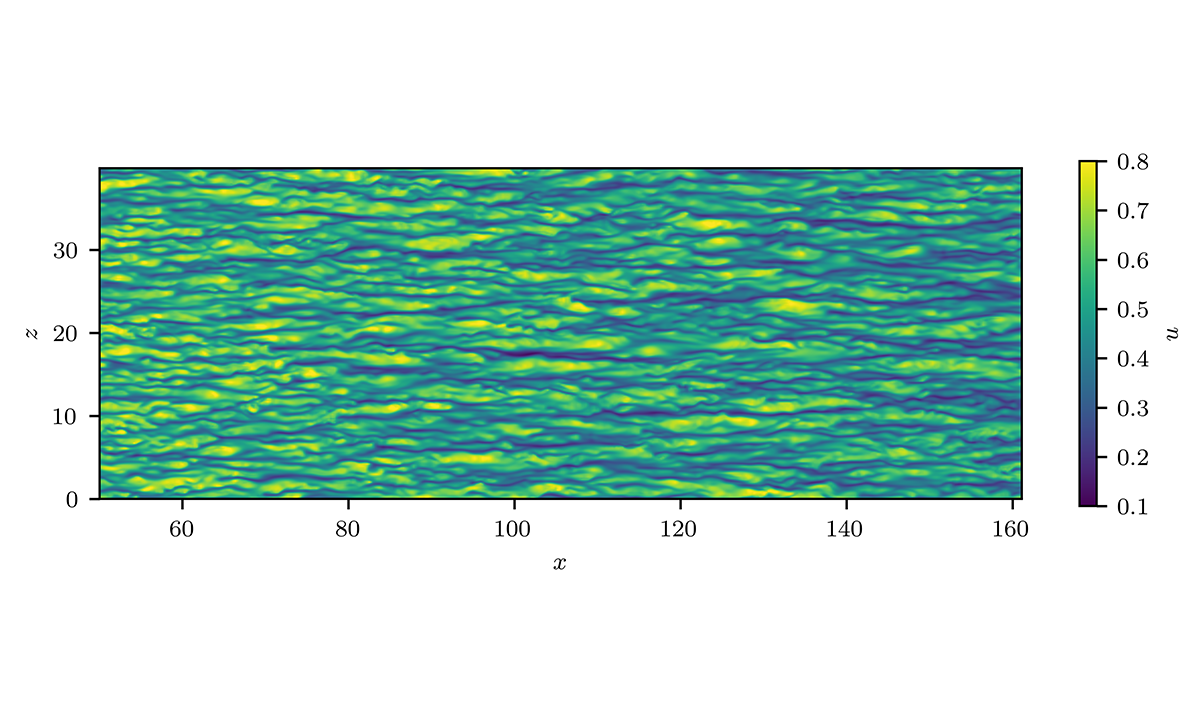
Figure 2: Example snapshot from the dataset, showing streamwise velocity near the wall.
We hope the dataset will support a range of future work, including the development and testing of turbulence theory, validation of lower-fidelity computational fluid dynamics models, comparison with experimental measurements, and training or evaluation of data-driven models. More broadly, the work illustrates how large-scale simulation on ARCHER2, combined with data publication through EIDF, can make high-resolution computational datasets available to the wider research community.
To get started, users can visit the CKAN dataset record and download the README file and example Python scripts.
Further details on the numerical setup, data structure, validation and access patterns are provided in the accompanying Data in Brief paper.