Three cinematic EPCC visualisations at SC25
11 November 2025
Three new scientific visualisations by EPCC will be presented at the "Art of HPC" sessions at SC25.
Established in 1988, the annual Supercomputing (SC) conference is an international event for high performance computing, networking, storage and analysis. EPCC staff will be taking part in both the exhibition and the conference programme at this year's event in St Louis, USA (see our Events section for details). Here Sébastien Lemaire gives an overview of our contribution to the "Art in HPC" sessions.
Electromagnetic simulation
The first video shows a realistic environment for an electromagnetic simulation performed on ARCHER2, the UK National Supercomputer. It demonstrates the propagation of electromagnetic fields moving from an above-ground source into the earth, modelling the fields' interactions with the materials they come into contact with. The electric field (blue) is emitted at the surface, travels through the ground and interacts with a pair of perpendicular metal pipes. These simulations enable the modelling of the return signature of subterranean structures and they have a variety of industry applications.
The simulation was performed by gprMax, an open source Finite-Difference Time-Domain electromagnetic simulation software that has recently been MPI-parallelised by EPCC. It uses an underlying grid of 750M cells and was run on eight nodes of the UK National Supercomputer ARCHER2.
Image credit: Sébastien Lemaire, Nathan Mannall, James Richings (all EPCC).
This video was the overall winner of the 2025 ARCHER2 image competition.
CFD simulation of Taylor-Green vortex
The second video is a CFD simulation of the Taylor-Green Vortex test case, showing the decay of turbulence in a visually appealing way. The Taylor-Green vortex test case is a common set up for benchmarking and validating CFD solvers. The flow is initialised with sin waves velocities which decay over time, showing the different scales of turbulence. The simulation at the centre of the visualisation was performed by ASiMoV-ccs, a CFD and combustion code designed for large scale simulations.
The simulation was run on 16 nodes for 20 hours on ARCHER2.
Image credit: Sébastien Lemaire, Paul Bartholomew, Erich Essmann, Michèle Weiland, Justs Zarins, Mark Parsons (all EPCC).
Periodic channel flow representation
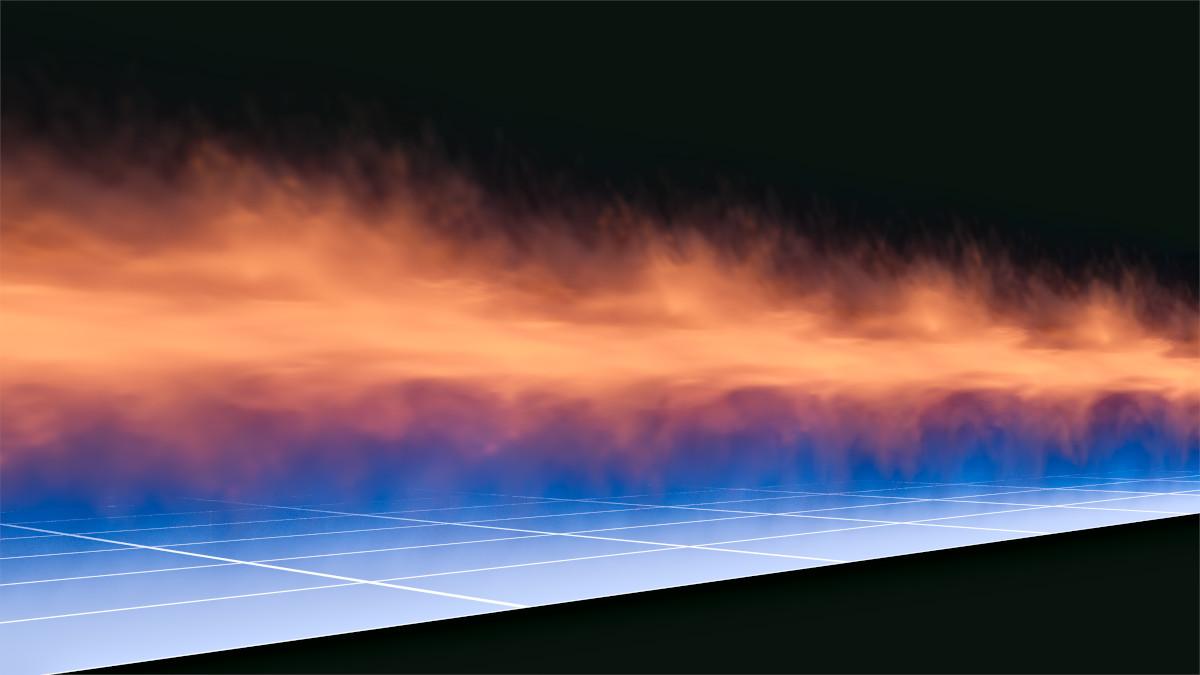
Finally, the third visualisation shows a fluid dynamics representation of a periodic channel flow performed by x3d2, a newly developed high-fidelity CFD solver with CPU and GPU backends.
A channel flow is a ubiquitous test case for analysing turbulence development and scales. The flow is bound by two infinitely large planes, and all the other directions are periodic (meaning the flow is recirculated once it leaves the computational domain). After an initial perturbation, all the scales of turbulence develop and are visible. In this image we highlight one of the infinitely long planes and the velocity field is displayed.
Image credit: Sébastien Lemaire (EPCC), Irufan Ahmed (Imperial College London), Paul Bartholomew (EPCC).
These three visualisations were rendered using a similar pipeline. Once the raw simulation data is obtained from the simulation software, ParaView is used to extract the quantities of interest and export openVDB files, which save the data in sparse volumetric data structures (a standard in the animation and vfx industries). Finally, the environment and scene are set up in the open source 3D software Blender, which also carries out the final rendering.
Links
To see more examples of our visualisation work, visit our Scientific visualisations page.