
Optimising the computational performance of high degree lithospheric field models
14 May 2026
The time required to compute a British Geological Survey model has been reduced from six days to one hour following a collaboration with EPCC. The model's resolution can now be increased to 20km, revealing the Earth's crustal magnetic field in unprecedented detail.
The British Geological Survey (BGS) World Magnetic Anomaly Model (WMAM) code calculates spherical harmonic models of the natural magnetisation of the Earth’s crust. These models allow us to estimate the value of the full magnetic field vector at any location, based on scattered pointwise marine or aero-magnetic measurements of only the scalar magnetic field. Modelling the magnetic field in this way serves many important purposes, such as geological research, navigation and safe resource extraction.
Global spherical harmonic models of degree and order 1440 (~28km spatial resolution) have been successfully computed on the HPC facilities local to BGS, but such runs require the full compute capacity for multiple days. Further, the available resolution of the scalar field measurements is too high to be fully exploited by the WMAM code, limiting models of the crustal magnetic field to a resolution of 28km.
To overcome these issues, EPCC refactored the WMAM code such that models of spherical harmonic degree 1440 and 2000 (~20 km resolution) can be produced in hours rather than days. For example, a degree 2000 model was calculated in three hours and 44 minutes using 64 HPE Cray EX nodes (8,192 cores) of ARCHER2.
The resulting magnetic field maps showed excellent agreement with the existing degree 1440 model and the original input data.
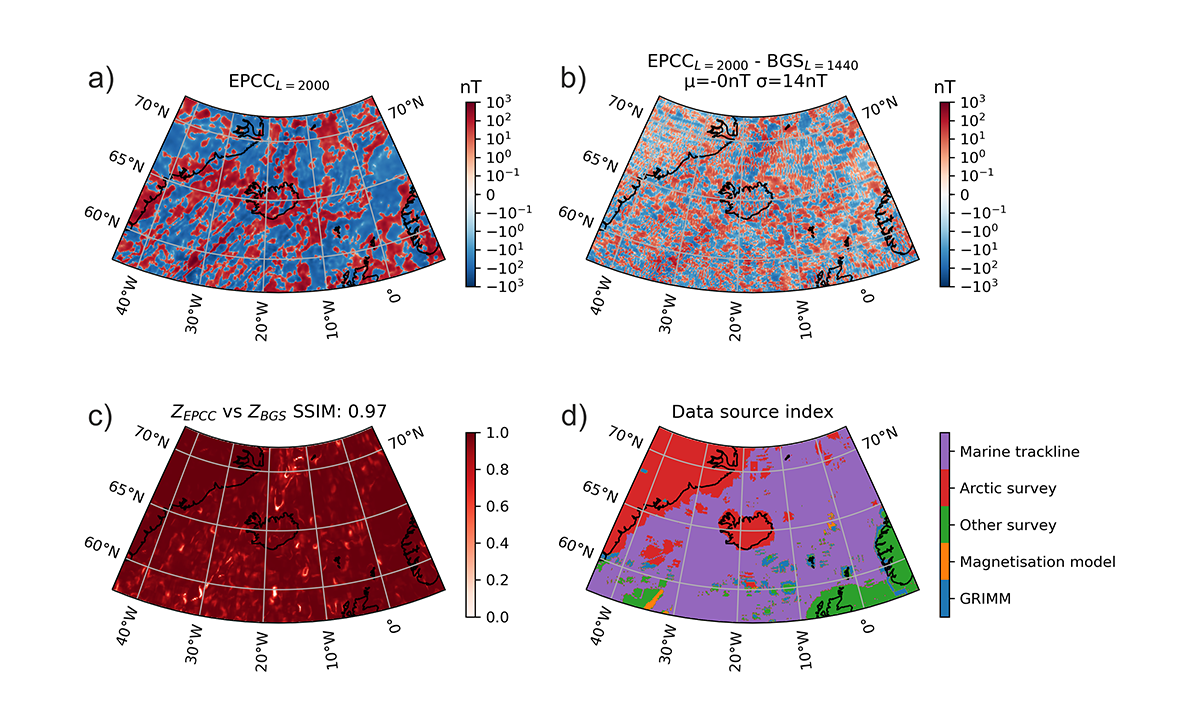
Figure 1. Validating the new 20 km model around Iceland: a) modelled vertical magnetic field at 20 km resolution; b) difference between 20 km (degree 2000) and 28 km (degree 1440) models; c) spatial correlation between 20 km and 28 km models; d) distribution of data sources in region.
Figure 1 shows four panels with contextual information of the crustal magnetic field in the North Atlantic Ocean around Iceland and Greenland. Panel (a) shows the vertical field due to the Earth’s crust. Panel (b) confirms that the differences between the 20 km and 28 km resolution models are small scale and do not appear to have an obvious correlation to geological structures seen in the first panel. The differences between the two models have zero mean and a standard deviation of 14 nT. A clearer view is given by the spatial correlation of the 20 km and 28 km maps in Panel (c). Here we see that the spatial correlation is very high, with an overall structural similarity index value of 0.97. Most of the region shows excellent correlation, indicating that the smaller spatial scale information in the 20 km model has mainly modified the amplitude of signals, i.e. there is no new or spurious structure introduced. Indeed, Panel (d) confirms there is no correlation between the regions of varying quality data sources and the differences between the two models. The areas of lowest correlation are small features aligned trending south-west to north-east and correspond to known geological features — the ocean bottom magnetic striping caused by the opening of the mid-Atlantic rift, which is better captured by the additional small scales of the 20 km model.
The performance of the WMAM code was further improved via the offloading to GPU of two loops that together accounted for nearly 70% of the runtime. We show the improvements due to GPU acceleration in terms of energy consumption as well as runtime.
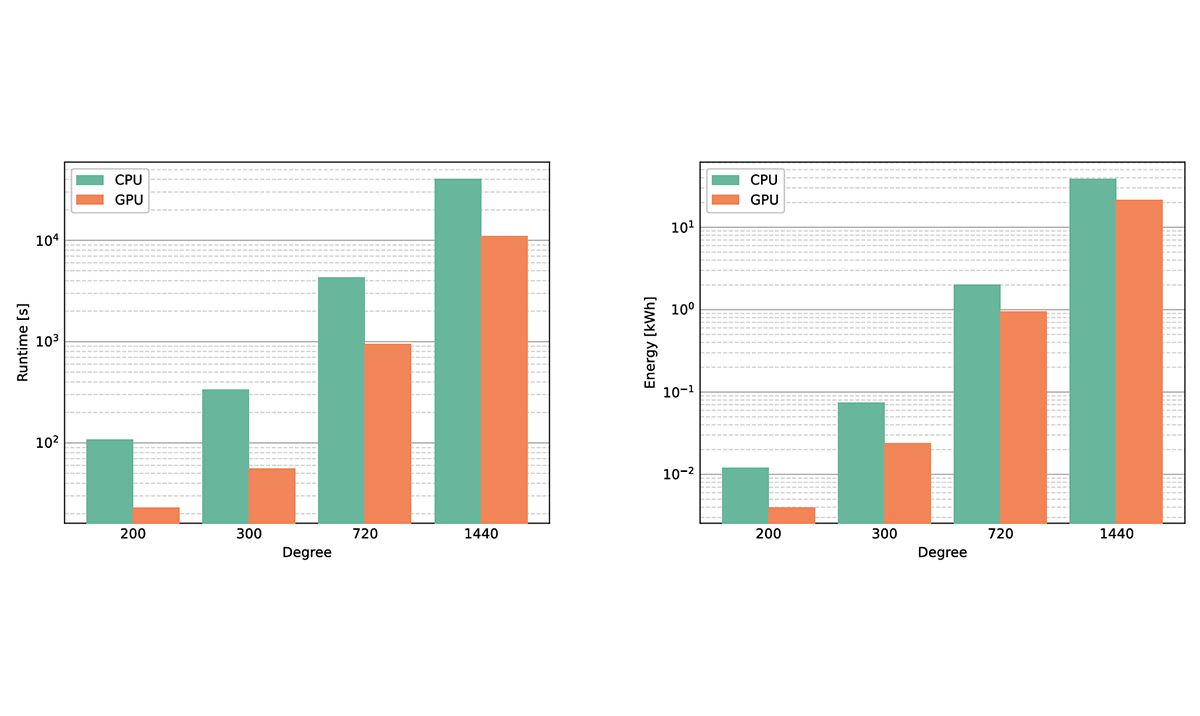
Figure 2. The WMAM CPU/GPU runtime and energy usage for degrees 200, 300, 720 and 1440. Both the CPU and GPU runs used 4 MPI tasks per compute node. The CPU runs used 10 Intel Cascade Lake cores per task, whereas the GPU runs used one NVIDIA V100 GPU per task. Starting from 1, the GPU node count doubles for successive degree values (the GPU count also doubles but starts from 4).
In Figure 2, we compare the CPU and GPU performance. At first glance, it appears the gap between GPU and CPU narrows as we increase the model degree. This impression is due to the logarithmic scaling: the performance boost due to GPU in fact changes little between model sizes.
The energy saving relative to WMAM CPU ranges from 45% to 68%, and the reduction in runtime is between 73% and 83%. Essentially, this comparison pits one NVIDIA V100 GPU against ten Intel Cascade Lake CPUs.
The NVIDIA V100 range of GPUs was launched in 2017, and since then NVIDIA has released the A100 and H100/200 GPUs, as well as the Grace Hopper Superchip, which features unified host and device memory. The main benefits of these later architectures are the greater memory size and improved memory performance. And so we ran the WMAM code on thirty-two A100 GPUs (across eight GPU nodes).
For the degree-1440 model, the average runtime over three runs was 3,379 ± 8.9 secs – about 56 minutes. Compared to the V100 GPU result, the runtime has reduced by a factor of 3.3. We also tested WMAM on a single Grace Hopper (GH200) Superchip, where the average runtime (again for the 1440 model) was 43,208 ± 3 secs – just over 12 hours. Compared to the A100 GPUs, this represents a further speedup (per GPU) of 2.5 times.
This fruitful collaboration, which brought together the expertise of BGS and EPCC, has resulted in a significant advancement for the computation of high degree models in geomagnetism and the wider potential field community.
Read more
We have made the code publicly available to allow further research into lithospheric modelling. See the WMAM GitHub code repository
Paper: 'Optimising the computational performance of high degree lithospheric field models'